Record Supply, Persistent Car Shortfall, and Rising Ocean Freight Costs Press the System Heading into Seeding — Full Report & Analysis
System Condition
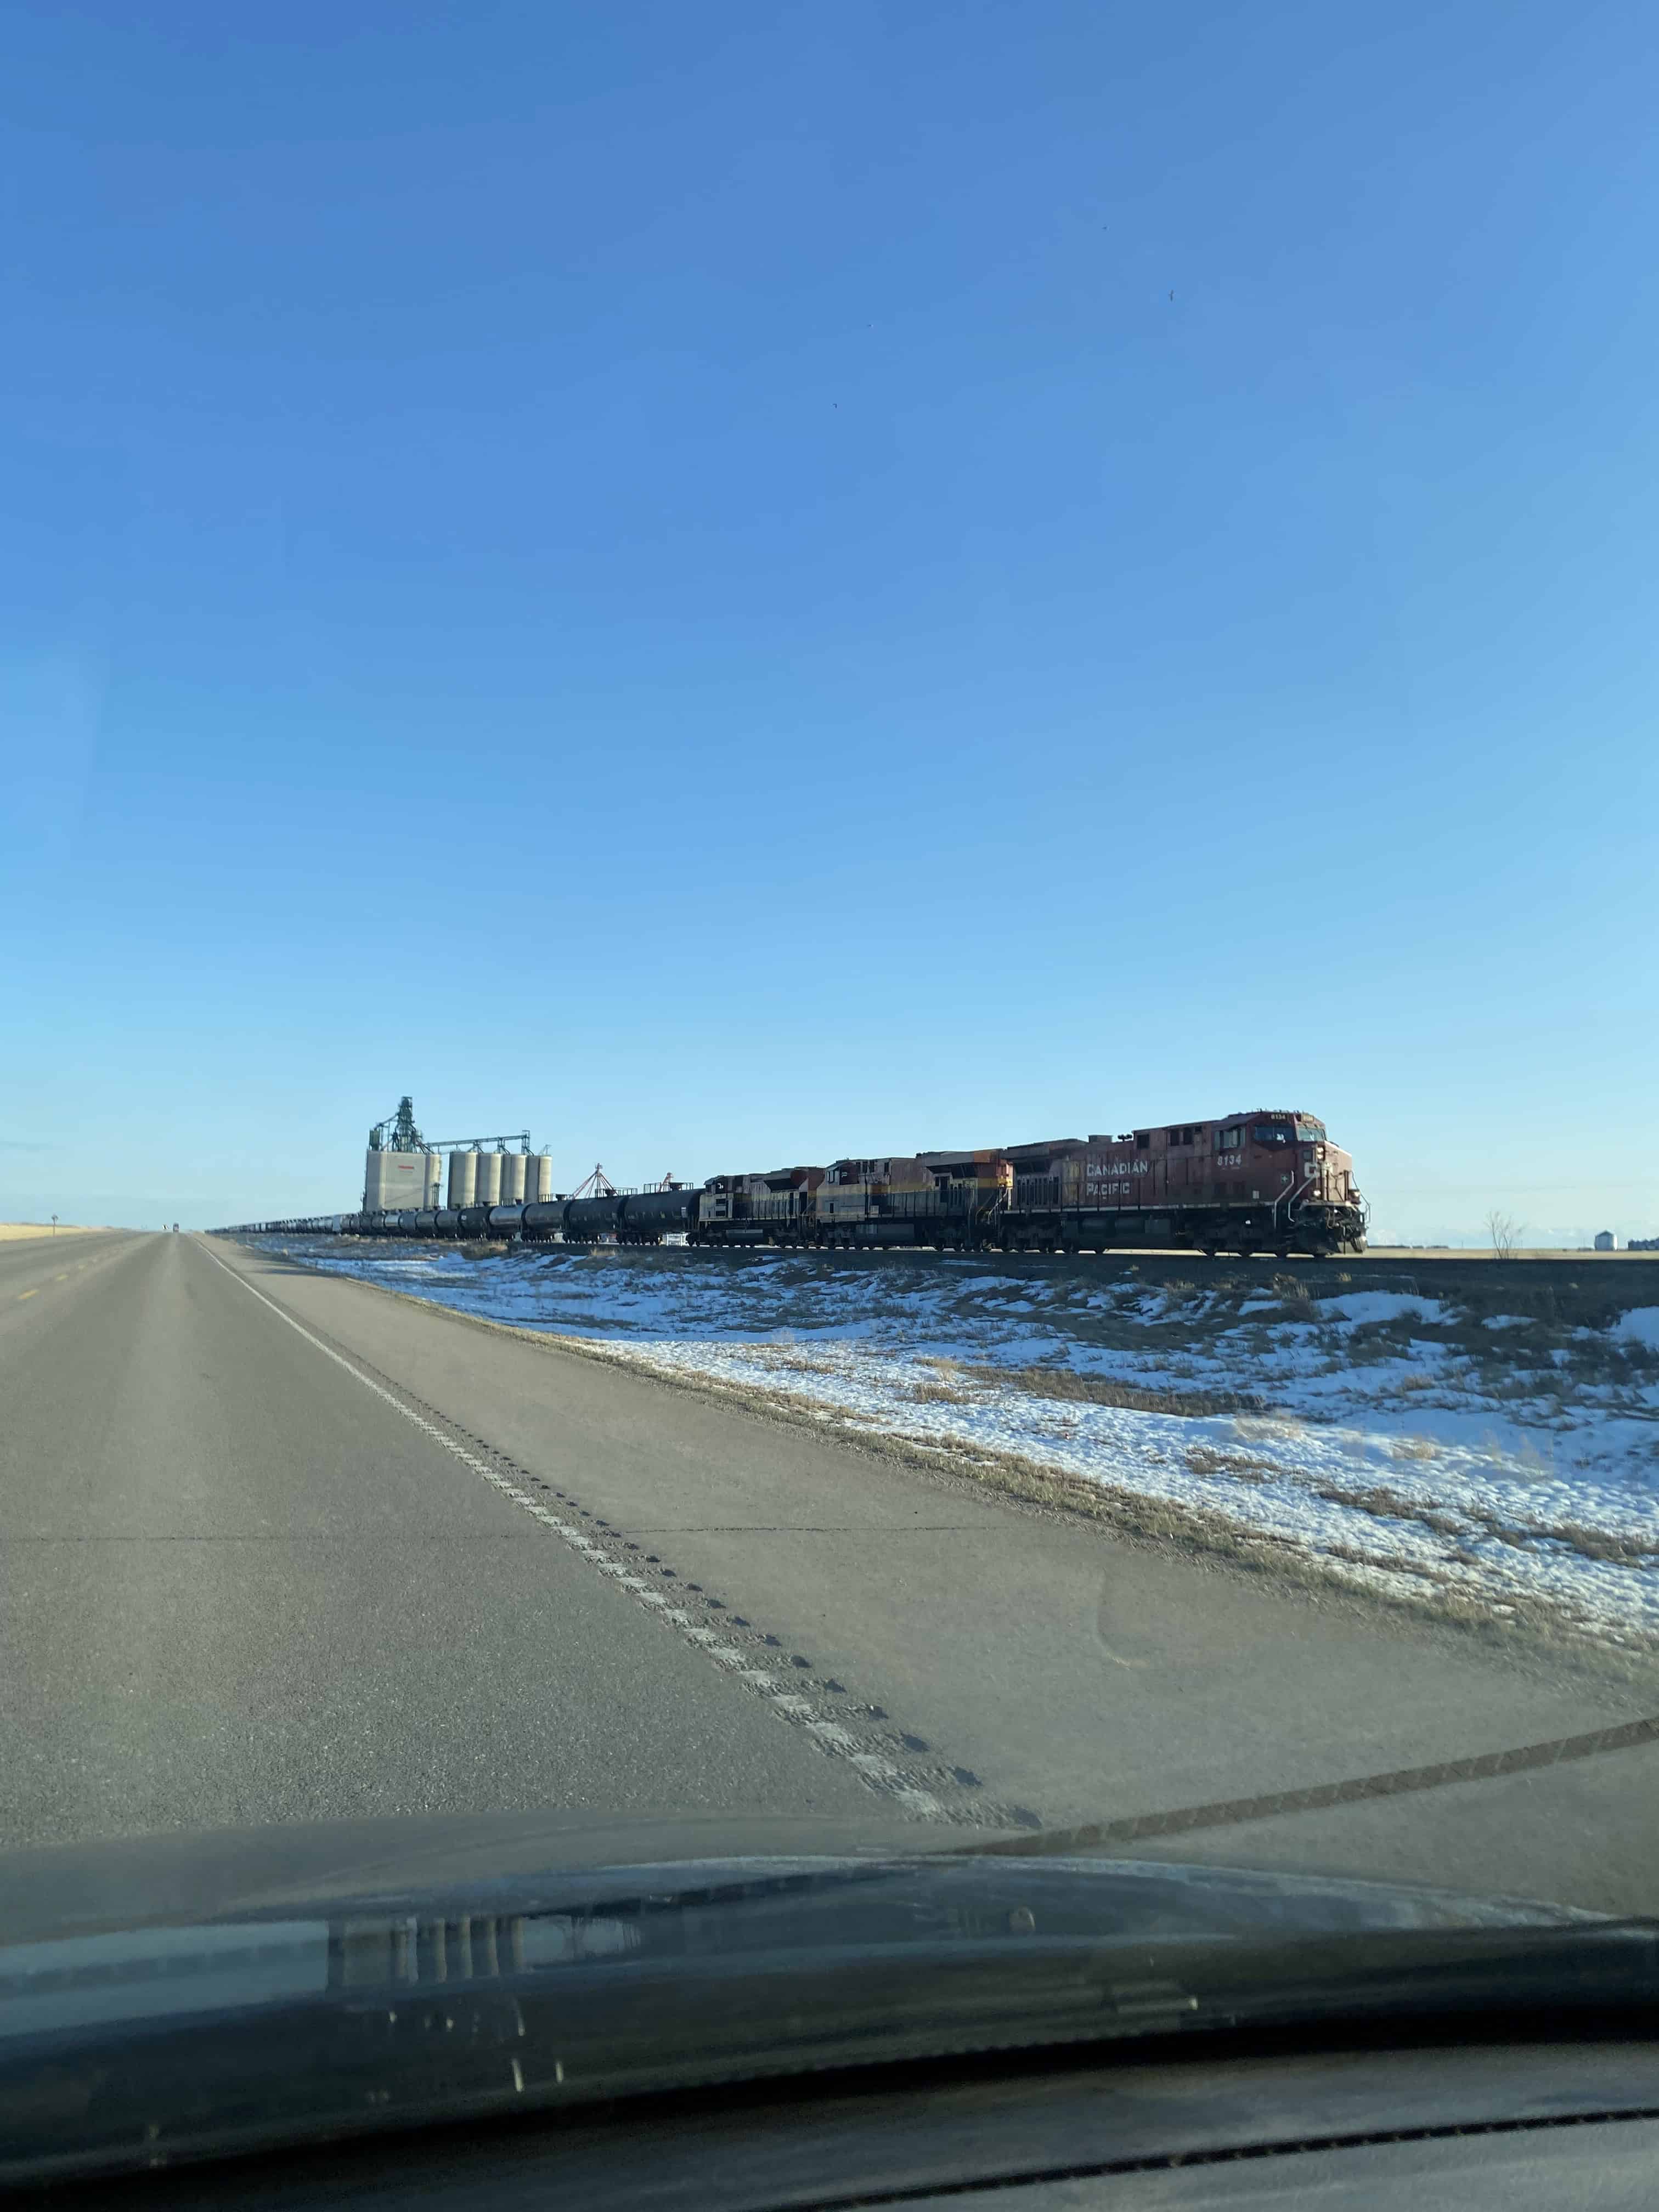
The 2025-26 crop year has produced the largest grain supply in Canadian history, and the transportation system is carrying it. According to the Quorum Corporation Prairie Grain Transportation Monitor, the 2025 harvest reached 85.4 million tonnes — a 15.6% increase over 2024 and the largest on record, exceeding the previous peak of 78.8 MMT set in 2020. When combined with carry-forward stocks, total grain supply for the crop year stands at 92.0 MMT — the first time it has ever exceeded 90 MMT.
Year-to-date western Canadian rail shipments through the first seven months of the crop year reached 36.8 MMT, up 4.9% from the same period last year, and total port shipments of 26.6 MMT are running 5.3% ahead of the prior year. On raw throughput numbers, the system appears to be functioning. The structural condition underlying those numbers tells a different story: the grain handling and transportation system is operating without slack against a supply load it has never carried before, and the strain is registering in the metrics that matter most — terminal out-of-car time, country elevator storage utilization, and a hopper car supply rate that has been running below the 90% performance threshold for an extended stretch of the crop year.
Corridor Status
West Coast — Vancouver
According to Quorum Corporation’s Week 39 Performance Update (covering the week of April 27–May 3, 2026, released May 12), the Vancouver vessel lineup as of Week 40 stood at 19 vessels — 8 at berth, 10 anchored at English Bay, and 1 at anchor off Vancouver Island. The current one-year average is 20 vessels, placing the lineup just inside the stress threshold. On a year-over-year basis the lineup is down 24%, reflecting the overall improvement in system throughput compared to the congested conditions of 2024-25.
The more significant Vancouver signal is terminal out-of-car time (OCT): 18.0% in Week 39. OCT measures the proportion of staffed terminal operating hours during which no rail cars are available to unload. At 18%, Vancouver terminals are sitting without cars to work nearly one-fifth of their operating time. This is not a vessel congestion problem — it is a rail car supply problem. Cars are not arriving at terminal elevators fast enough to keep pace with vessel demand, even as the vessel lineup itself remains manageable.
Vancouver terminal stocks were consistently above 90% of working capacity through February, according to the February 2026 monthly report. That figure has eased as the crop year progresses, but terminal storage utilization at these levels throughout the peak movement period confirms the system has been operating near capacity on the landside for most of the crop year.
West Coast — Prince Rupert
The Prince Rupert lineup stood at 2 vessels as of Week 40, matching the one-year average and well within normal operating range. Out-of-car time at Prince Rupert in Week 39 was 25.0% — higher than Vancouver’s. The Prince Rupert terminal operates at lower throughput volumes than Vancouver but with less redundancy in its car supply chain, making it more sensitive to any disruption in CN’s northern corridor performance.
Year-to-date Prince Rupert shipments are running 17% above the 3-year average — a significant outperformance that reflects both the record supply volume and CN’s strong early-year performance on the northern corridor before conditions deteriorated in the second half of the crop year.
Thunder Bay
Thunder Bay unloads in Week 39 were 1,853 cars — 20% below the same week last year and 8% below the 4-week moving average. With the St. Lawrence Seaway re-opened following its winter closure, the Thunder Bay corridor is active, but the year-over-year decline in unloads at this stage of the crop year reflects both the west coast bias in this year’s movement pattern and the record supply already processed through western ports. Year-to-date Thunder Bay shipments are running 3% above the 3-year average but essentially flat to last year.
Rail — Car Supply
The February 2026 monthly report shows the hopper car fleet at 96% deployment — nearly the entire fleet in active grain service. Car cycle time to western ports averaged 13.2 days year-to-date, down 9.8% from the prior year’s 14.6-day average, which is a genuine efficiency improvement. Loaded transit times to western ports averaged 5.4 days — down 13.1% from the prior year.
These improvements reflect the relatively clean operating conditions through the early months of the crop year. The deterioration came in mid-crop-year, with both CN and CPKC running below the 90% hopper car fulfillment threshold for an extended consecutive stretch heading into spring. With 96% of the fleet already deployed, the railways have no meaningful reserve to draw on when conditions tighten. Country elevator stocks at 73% of working capacity system-wide — and 85% in Manitoba — confirm that the strain on the country system is real, with grain accumulating in primary elevators faster than it is moving out.
Producer Impact
The transportation system is delivering record volumes, and producers with grain contracted for delivery are largely getting cars. The problem is that the margin between what the system can supply and what producers and elevators are ordering has been negative for an extended period, and that gap has consequences that compound over time.
Country elevator stocks at or above 70% of working capacity system-wide — and higher in Manitoba — mean that primary elevator receival capacity is constrained. Elevators managing their own storage utilization reduce or suspend spot buying, which limits the price competition available to producers at the farm gate. This is a direct basis implication: when elevator space tightens, the spread between farm gate and futures widens.
Ocean freight costs are adding to that pressure. The Baltic Panamax Index, the most relevant freight benchmark for Canadian grain movements to Asian and other deep-sea markets, was trading at approximately 2,511–2,521 points as of May 18–19, 2026 — with average daily Panamax earnings in the range of USD $22,500–22,700. The BPI posted a weekly gain of roughly 5.8% in the week ending May 15, continuing an upward trend. Rising Panamax rates mean the ocean freight cost embedded in elevator basis is increasing. As freight costs rise, the freight component of the country elevator basis typically widens, reducing the net price producers receive at the farm gate for unpriced or spot-priced grain.
Producers carrying unpriced grain into the back half of the crop year are facing a compression from both directions: country elevator storage pressure weighing on spot bids, and rising ocean freight costs widening the freight component of basis.
Seasonal Context
The current country elevator storage utilization of 73% system-wide compares to a 3-year average utilization at this point in the crop year of approximately 67% — roughly 6 percentage points above normal. Manitoba at 85% is the most stressed province. This above-average storage loading is a direct consequence of the record supply: more grain in the system than the prior three years would lead anyone to expect at this point in the marketing year.
On vessel lineup, the current 19-vessel count at Vancouver is running just below the one-year average and well below the stress levels seen earlier in the 2024-25 crop year, when lineups spiked to 47 vessels at their worst point. Year-over-year vessel time in port through February averaged just 8.0 days — 25.9% better than the same period a year earlier. The port-side of the system is functioning well by recent historical standards. The constraint is on the rail and country elevator side.
The year-to-date throughput of 34,586 kt at Week 39 — running 7% above last year and 9% above the 3-year average — confirms the system is genuinely moving more grain than ever before. The concern is not throughput failure; it is the absence of any reserve capacity when conditions deteriorate, and the accumulated storage pressure that builds when car supply runs below ordered levels for an extended stretch.
Cross-Reference to Related WFR Coverage
Prairie Rail, Port, & Crop Movement
South East Asia Grain Import Demand
What This Means For You
The system is moving grain — that needs to be stated plainly. Year-to-date shipments are running 7% ahead of last year at a point in the crop year when the total supply is historically unprecedented. If you have grain contracted and cars allocated, deliveries are happening.
The question for producers with unpriced or uncommitted grain is whether the current conditions argue for urgency or patience. The case for urgency: country elevator storage utilization is above seasonal norms and rising ocean freight costs are pressing basis wider. The combination means spot bids at country elevators are under structural downward pressure that is unlikely to reverse until either storage space clears or Panamax rates retreat. Waiting for basis improvement while both of those forces are working against you carries real cost.
The case for patience is narrower but worth naming. The crop year ends July 31. If you have on-farm storage and no carrying cost pressure, the next meaningful data point to watch is the CN collective agreement, which expires December 31, 2026. That expiry is a known risk event for next crop year, not this one — but early signals from the Teamsters Canada Rail Conference suggest unresolved issues around scheduling and rest protections will be back at the table. A disruption at CN in late 2026 would press car supply sharply for the early months of the 2026-27 crop year. Producers who move remaining 2025-26 grain now rather than carrying it into the new crop year avoid exposure to that risk.
Watch the Prince Rupert out-of-car time figure specifically. At 25% in Week 39, it is the highest of any terminal and reflects the tightest point in CN’s northern corridor supply chain. If that number climbs further as the crop year ends and the summer maintenance period approaches, it will be an early signal of where rail supply stress concentrates heading into harvest.
What to Watch
Quorum Corporation Prairie Grain Transportation Monitor — weekly and monthly. Week 40 performance update will be released shortly; the April 2026 monthly report (the final full month of the crop year) is the next major data release. Monitor terminal out-of-car time at Vancouver and Prince Rupert, country elevator storage utilization by province, and car cycle times. Source: grainmonitor.ca
Baltic Panamax Index (BPI) — daily. The primary ocean freight cost benchmark for Canadian grain export routes. Currently at approximately 2,511–2,521 points with daily Panamax earnings near USD $22,700. Any sustained move above 2,600 points will intensify basis pressure on canola and wheat at Prairie delivery points. Source: balticexchange.com
CN–TCRC collective agreement — expiry December 31, 2026. New bargaining for CN’s approximately 6,000 conductors, yard coordinators, and locomotive engineers will begin in H2 2026. The Teamsters Canada Rail Conference has publicly flagged unresolved issues on scheduling and rest protections. Monitor CN and Transport Canada for bargaining notices. This is the single largest labour risk event on the Prairie transportation calendar for the balance of 2026. Source: cn.ca
Country elevator stocks by province — Quorum Corporation weekly. Manitoba at 85% of working capacity is the threshold to watch. If Alberta or Saskatchewan approach 80%, the storage pressure and basis implications become systemic rather than regional.
Tags: west coast grain corridor, hopper car supply, CN Rail, CPKC, Vancouver grain terminal, Prince Rupert grain terminal, Baltic Panamax Index, grain basis, country elevator storage, CN TCRC collective agreement
Unfamiliar with grain transportation terminology? See the WFR Transportation Glossary for definitions of key terms used in this post. Note: The “#” placeholder must be replaced with the live WFR Transportation Glossary URL once the page is built — this is a pending website development task.
This post was produced with AI assistance. All sources are attributed and linked. Western Farm Report editorial standards apply.