Grain on the Move: What Rail Performance Means for Prairie Crop Delivery in 2025-26
The 2025-26 crop year has been marked by record grain volumes and persistent rail service shortfalls — a combination that should concern any Prairie producer with grain still in the bin. Both CN and CPKC have moved impressive tonnage, but hopper car fulfillment has been running below acceptable thresholds for months, and the reasons go well beyond weather. Understanding what is driving the performance gaps, and where the choke points sit, is directly relevant to decisions about delivery timing, elevator contracts, and cash flow planning.
Record Volumes, Below-Target Service
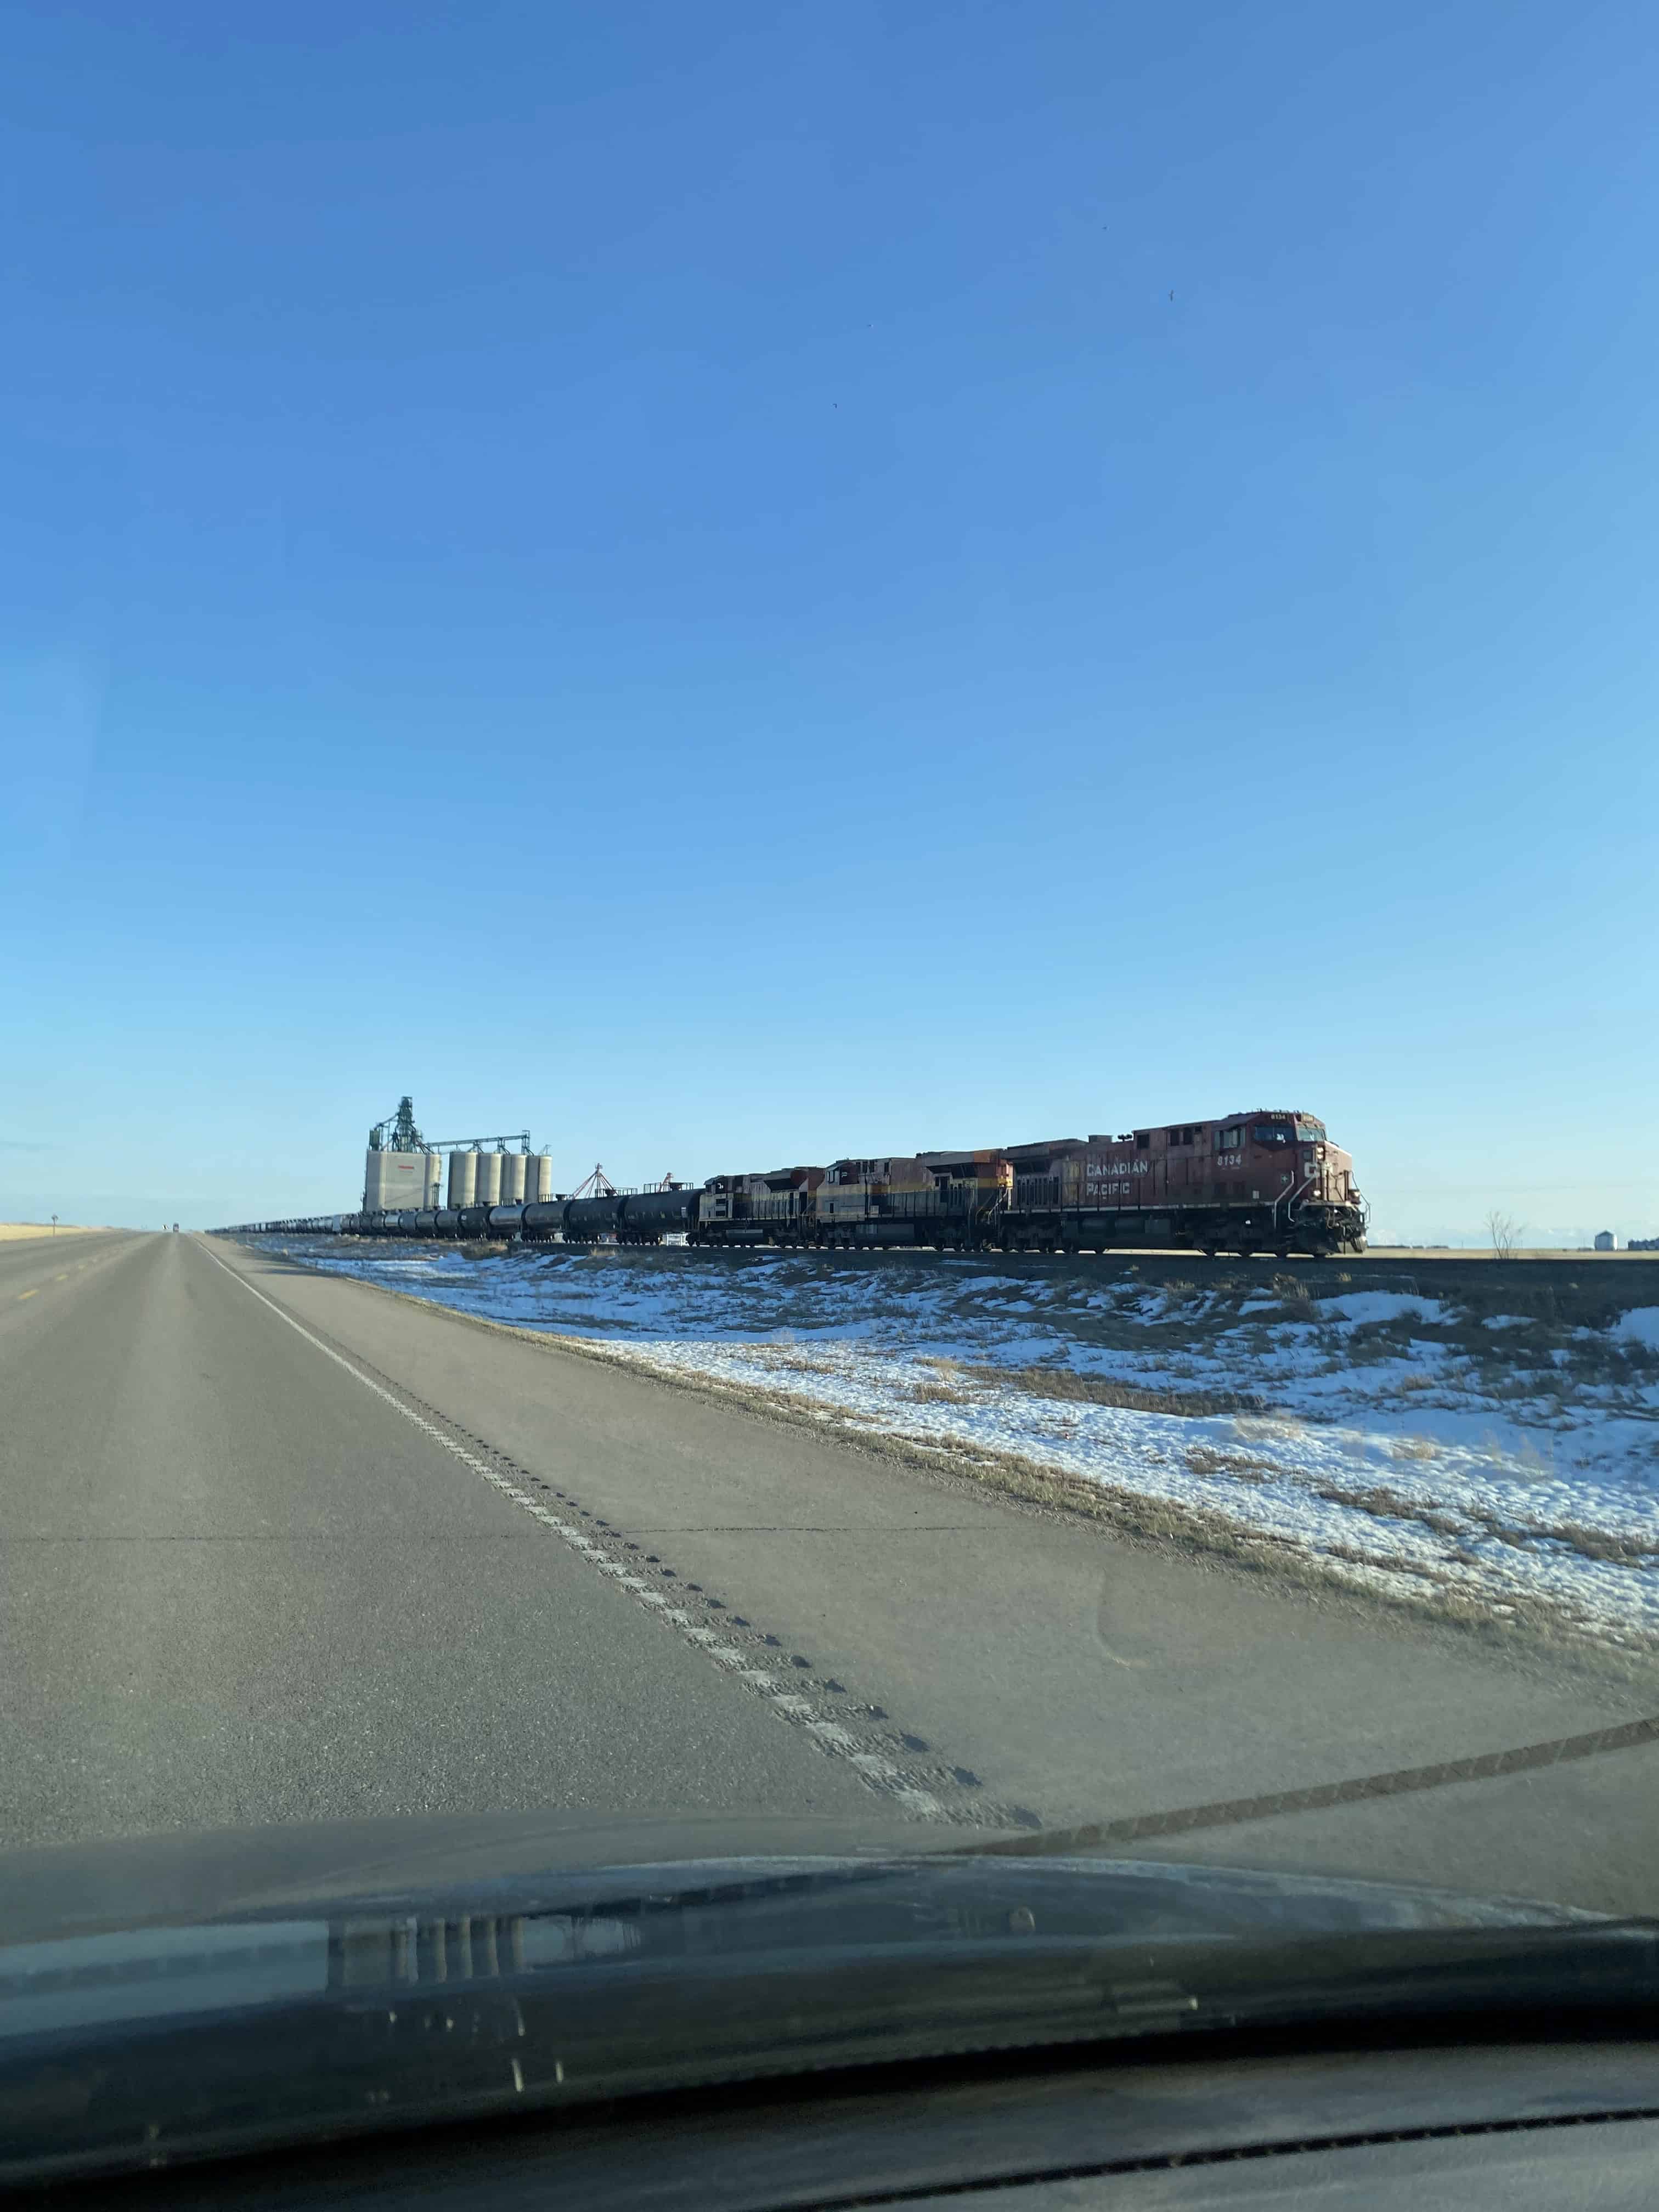
CN set its best-ever March for grain haulage in 2026, moving more than 2.96 million tonnes from Western Canada — the strongest first quarter for grain in the company’s history, with weekly volumes peaking above 650,000 tonnes. February was similarly strong, setting a new monthly record at 2.67 million tonnes. CPKC also opened 2026 with a record January, shipping 2.395 million metric tonnes and setting new January highs for both tonnage and carloads.
Through the first 26 weeks of the 2025-26 crop year, CPKC moved more than 15.1 million tonnes of grain and grain products — the largest volume since the 2020-21 crop year. CN’s grain plan for the current crop year targets 27.0 to 29.5 MMT of grain and processed grain products moved, with the company describing its resources as sufficient under normal operating conditions. CPKC’s plan targets up to 34 MMT for the year, contingent on the full supply chain operating efficiently.
The volume numbers look good in isolation. The service quality numbers do not. The Ag Transport Coalition tracks weekly hopper car fulfillment — the percentage of ordered cars that railways actually deliver in the requested week — and the industry benchmark for acceptable service is 90%. Both railways have been consistently below that mark for most of the crop year since late January.
Hopper Car Fulfillment: The Numbers That Matter to Shippers
The Ag Transport Coalition’s weekly reporting provides the clearest picture of actual service delivery versus demand. In week 29 of the 2025-26 grain year, system performance hit what was then the worst level of the year, with CN and CPKC combined delivering only 68% of ordered hopper cars. CPKC’s performance that week fell to 52% — the worst of the crop year to that point, a level it held for three consecutive weeks.
The most recent Ag Transport Coalition data, for week 34 (the week of April 6, 2026), showed modest improvement. Combined system performance reached 80% — the best since week 25 in mid-January, and a meaningful recovery from the 65% recorded the prior week. CN supplied 85% of ordered cars in week 34, up from 79% in week 33. CPKC improved to 75% from 52% in week 33, its best performance in eight weeks.
Even with that recovery, system performance has remained below the 90% threshold for ten consecutive weeks as of week 34. CPKC had been below 90% for nine straight weeks and below 80% for eight. These are not brief weather-related blips — they represent a sustained period of undersupply relative to shipper demand.
For producers, the practical implication is straightforward: when your elevator cannot receive grain on its expected rail schedule, it backs up inventory and restricts its ability to take on new deliveries. Elevator operators manage their space against expected car supply, and when cars do not show up, they reduce or eliminate commercial buying. The impact works its way back to the farm gate quickly.
What RTM and Velocity Tell You
Revenue Ton Miles (RTM) measure the volume of freight moved over distance and are the broadest indicator of rail network productivity. Both CN and CPKC have posted strong RTM growth this crop year, reflecting the high volumes of grain moving through their systems. RTM is the number the railways lead with in investor presentations and annual reports, and for good reason — it shows the commercial throughput of the network.
Train velocity — the average speed at which trains move across the network, typically measured in miles per day — is a more granular indicator of network fluidity. When velocity drops, it often signals congestion, equipment shortages, or operating constraints that are slowing train cycles. Slower cycles mean hoppers take longer to get from the port back to Prairie elevators, which reduces the effective supply of cars available to shippers even if the total fleet size has not changed.
Dwell time — the average hours a car sits at a terminal or origin location before departing — is directly related to velocity. High dwell times at port terminals mean cars are waiting to unload instead of cycling back to the Prairies. High origin dwell means cars are sitting at country elevators waiting for a train rather than loading efficiently. Both metrics affect the pace at which the network can serve shipper demand.
For the current crop year, both railways have cited weather-related speed restrictions, particularly extreme cold in late 2025 and early 2026, as a contributor to reduced velocity and elevated dwell. CN noted in its 2025-26 grain plan that it faced nearly double the number of days requiring safety-critical train length and speed restrictions this past winter compared to the winter of 2023-24. Those restrictions slow the network and reduce car cycle efficiency, compounding the pressure on hopper car availability.
The Vancouver Bottleneck: Rain, Bridges, and Competing Traffic
Vancouver handles the largest share of Western Canadian grain exports among all port gateways. In the 2024-25 crop year, the port moved approximately 18.34 million tonnes of grain through to week 30 of the year, ahead of the prior year’s pace. Those are strong numbers — but the Port of Vancouver carries structural vulnerabilities that every Prairie producer should understand, because they directly affect how quickly the system can absorb high-volume grain movement.
The most persistent constraint is the inability to load grain vessels during rain. When it rains at Vancouver — which happens roughly 30 to 60 days per year by one Transport Canada estimate, concentrated in the fall and winter — grain loading stops or slows significantly. When grain cannot be loaded onto ships, hopper cars cannot be emptied and returned to the Prairies. The ripple effect is immediate: cars pile up at port terminals, origin dwell rises at country elevators, and the system backs up. One industry analysis put efficiency losses from rain stoppages alone at more than 30%.
The rain loading problem has been discussed for years without a system-wide solution. Pilot projects and trials have been completed at a couple of Vancouver terminals for the 2025-26 marketing year, with the Port of Vancouver indicating those terminals will begin rolling out new procedures during the current campaign. Full adoption across terminals has not yet happened. CN has been direct in its grain plans about the problem: rain is predictable, rain is solvable, and modern grain terminal operations elsewhere manage it. The Canadian industry has not yet done so at scale.
A second constraint at Vancouver is CN’s Second Narrows lift bridge over Burrard Inlet, which provides the rail access to grain terminals on Vancouver’s North Shore. The completion of the Trans Mountain Expansion pipeline in 2024 increased marine tanker traffic through the port by approximately 700%. More tanker movements mean more bridge lifts, which block train access to and from grain terminals. CN has flagged this as a growing capacity issue. The Active Vessel Traffic Management system now coordinates ship and train scheduling more effectively, and CN credits it with a 10% increase in weekly train counts to and from North Vancouver — but the bridge remains a structural pinch point.
Recent terminal investment at Vancouver is helping on the capacity side. Richardson’s bulk grain terminal railyard was upgraded, increasing annual capacity to seven million tonnes from six million. Cascadia’s bulk grain terminal expanded its railyard to allow assembly of 2,600-metre trains on site. These are meaningful improvements, but they address throughput — not the weather and bridge constraints that interrupt it.
Prince Rupert: A Growing Alternative Corridor
The Port of Prince Rupert serves as the second major West Coast export gateway for Canadian grain, exclusively via CN’s northern rail corridor. For Peace River region producers and those in northern Alberta and Saskatchewan, Prince Rupert Grain Terminal is the primary bulk export option. It has capacity to move approximately 7.5 million tonnes of grain annually and is the third-largest grain export port in Canada behind Vancouver and Thunder Bay.
Prince Rupert’s overall cargo volumes grew 14% in 2025 to 26.3 million tonnes. Agricultural exports through Prince Rupert Grain Terminal increased 8% compared to 2024, supported by strong crop volumes. The port’s geographic advantage — it is the closest North American West Coast port to Asia, approximately three sailing days closer than Los Angeles — makes it a competitive routing option particularly for Asian markets.
The Prince Rupert corridor is CN-exclusive, which creates both an advantage and a risk. Producers and elevators routing through Prince Rupert have only one railway option, meaning any CN network disruption on the northern corridor has no alternative routing. CN’s grain plan for 2025-26 noted that the Prince Rupert route may sometimes operate at capacity given high crop volumes and strong export demand.
CN launched its Zanardi Rapids Bridge Expansion project in 2025, involving several kilometres of new track and a 1,600-foot two-track bridge, with completion expected in 2027. That project is designed to support the port’s broader expansion plans, which include more than $3 billion in capital investment across multiple projects expected to come online in 2026 and 2027. The CANXPORT transloading facility at Prince Rupert, operated by Ray-Mont Logistics, is scheduled to begin expanded operations in mid-2026, adding container export capacity for grain and specialty crops.
Thunder Bay: The Eastern Option and Its Seasonal Limits
The Port of Thunder Bay on Lake Superior is Canada’s third major grain export gateway and handles significant volumes for eastern export corridors via the St. Lawrence Seaway. Both CN and CPKC serve Thunder Bay. The port operates from approximately April through January, closing during the winter months when the Great Lakes freeze.
The seasonal closure is a significant constraint on the system as a whole. When Thunder Bay closes in winter, all export grain must move through Vancouver or Prince Rupert. CPKC plans weekly capacity of 685,000 metric tonnes when Thunder Bay is open, dropping to 525,000 metric tonnes in winter months when routing shifts exclusively to West Coast ports. CN manages a similar seasonal adjustment. The winter concentration of grain movement to West Coast corridors is one reason why December through March consistently shows the most stress on hopper car supply — it is the period when system capacity is tightest relative to demand.
Labour, Regulatory, and Operational Factors
The 2024-25 crop year saw CN deliver its highest grain volumes since 2020-21, despite what CN described as multiple supply chain labour disruptions, tariff uncertainty, and significantly worse winter weather than the prior year. Labour availability has been a recurring concern for both railways. CN’s grain plan for 2025-26 flagged operating crew availability as a challenge, noting that federal labour regulations that came into effect in May 2023 require approximately 15% more people to move the same amount of freight. Hiring and retention have both been focus areas for the railways.
Extended interswitching rules — a federal regulatory mechanism that allows shippers to access competing railways over a broader distance — have been a point of contention. CN has argued these rules reduce capacity and efficiency on its network. The rules were due to expire in March 2025 and their renewal or modification remains a factor in the operating environment both railways are managing.
Labour disputes at ports represent a separate but connected risk. The 2024-25 crop year saw port labour disruptions that temporarily constrained terminal operations at Vancouver. Both railways cited these disruptions in their year-end assessments. The potential for future port labour actions remains a risk that producers and elevator operators cannot control but need to account for in marketing plans — particularly for contracts with tight delivery windows.
What This Means for Delivery Planning
The practical takeaway from this crop year’s rail performance is that the supply chain is moving large volumes — record volumes in several instances — but it is doing so with limited buffer capacity. When one element of the system underperforms, whether that is a cold snap that slows train operations, a rainy week in Vancouver that halts ship loading, or a spike in demand as producers move grain ahead of seeding, the impact propagates quickly through the system.
For producers marketing grain through to the end of this crop year (July 31, 2026) and planning the opening of the 2026-27 crop year, a few points are worth keeping in mind. First, the spring period before seeding typically sees a rush of grain deliveries as producers clear bins. That concentration of demand puts additional pressure on hopper car supply at exactly the time when the railways are also managing network maintenance and pre-seeding crew transitions. Elevator space tightens accordingly.
Second, the rain loading situation at Vancouver is unlikely to be fully resolved before the 2026-27 crop year begins. The pilot rollout is underway at a small number of terminals, but system-wide adoption takes time. Weather events in Vancouver this fall and winter will again slow port throughput on rainy days, slowing car cycles and tightening hopper car availability on the Prairies.
Third, producers with grain contracted for delivery on specific dates should maintain close communication with their elevator on car supply. When the Ag Transport Coalition reports fulfillment below 80% system-wide, some elevators are not receiving enough cars to clear their own intake obligations on schedule, which can affect their ability to accept new producer deliveries even when space is nominally available.
The Statistics Canada Grain Supply Chain Dashboard, available online and updated daily, provides real-time tracking of grain car movements by corridor, including 48-hour dwell flags that identify where cars are sitting. It is a useful tool for understanding where the system is backed up at any given time. CN’s Western Canadian Grain Report, published weekly, provides additional data on car supply, shipments by corridor, and outstanding shipper orders. Both are publicly accessible and worth monitoring regularly if you have significant grain still to move.
The record export volumes this crop year demonstrate that the system can move large amounts of grain when conditions align. The persistent hopper car shortfalls demonstrate that alignment is not the default state — it requires every element of a complex supply chain, from country elevator to port terminal, to perform at or above plan simultaneously. That rarely happens for an entire crop year. Building flexibility into delivery schedules, staying current on weekly rail performance data, and communicating early with your elevator when plans change remain the most direct tools producers have for managing a supply chain they otherwise have limited influence over.